Description
We on the VS Code team just released a debugging recipe for Vue.js, to allow our Chrome debugger to debug Vue, and during this release we discovered some fundamental problems with the sourcemaps generated by vue-loader used in the webpack projects generated by vue-cli,
Observed problems
-
The generated sourcemaps seems to be invalid and unreadable for tools like https://sokra.github.io/source-map-visualization/
-
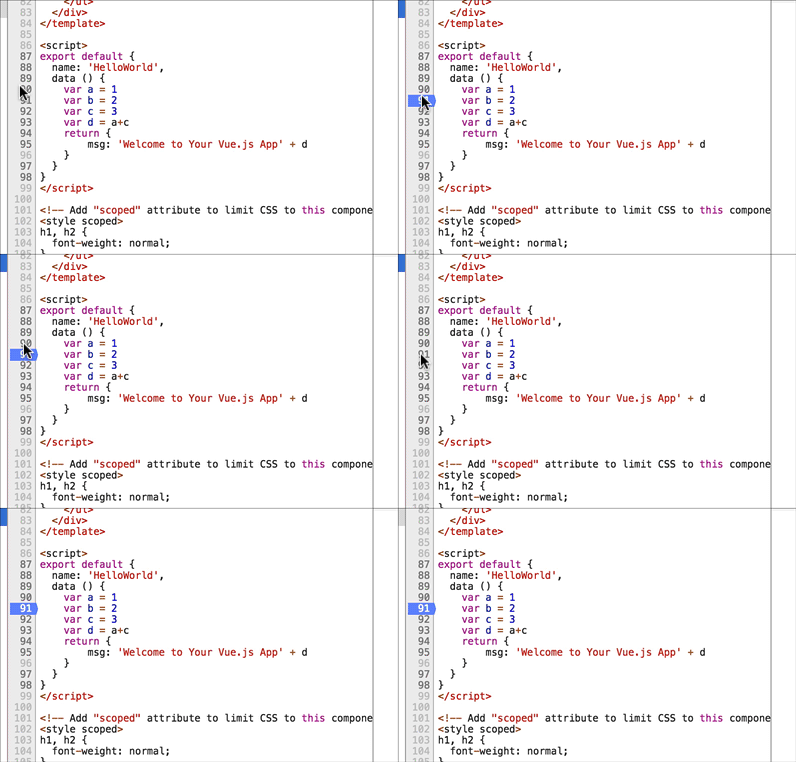
Stepping in debuggers like Chrome DevTools and VS Code doesn't work as expected, as we experience "sliding breakpoints" caused by missing mappings that causes us to "slide" the breakpoint down to the next line we have mappings for. Causes experiences like:

-
Mappings for simple statements seems to be missing/wrong, which causes debuggers to load the compiled source, which causes experiences like, where a breakpoint is set on line 94, but is in reality set in a different place.

-
Generated entries for sourcefiles are added to the sourcemap under the
.path, which creates confusion, as the files under./srcare generated outputs, and not the original authoring abstraction. This is causing problems for debuggers like VS Code that relies on mappings between the served bundle and the original original authoring abstraction.
In this example the original authoring abstraction is also referenced under /src/components/HelloWorld.vue
- Using
letstatements for variables seems to cause problems for the sourcemaps, as both VS Code and Chrome DevTools can't step over the statements, but stays on the same line when using step-over.
Steps to reproduce
- Generate webpack project by vue-cli
- Add a few new lines to line 90 in
HelloWorld.vue, so you have logic like:
export default {
  name: 'HelloWorld',
  data () {
    var a = 1
    var b = 2
    var c = 3
    var d = a+c
    return {
        msg: 'Welcome to Your Vue.js App' + d
    }
  }
}
- Open up Chrome DevTools or the VS Code debugger, and try to set breakpoints in
HelloWorld.vue
Relevant issues

