Closed
Description
Nature of issue?
I believe this is a bug, possibly a regression in recent browser versions? But perhaps it has never worked and this is a feature request?
Details about the bug:
There are a number of issues with the the way the p5.js Web Editor loads the sketch javascript that makes it not work well with Chrome/Chromium developer tools:
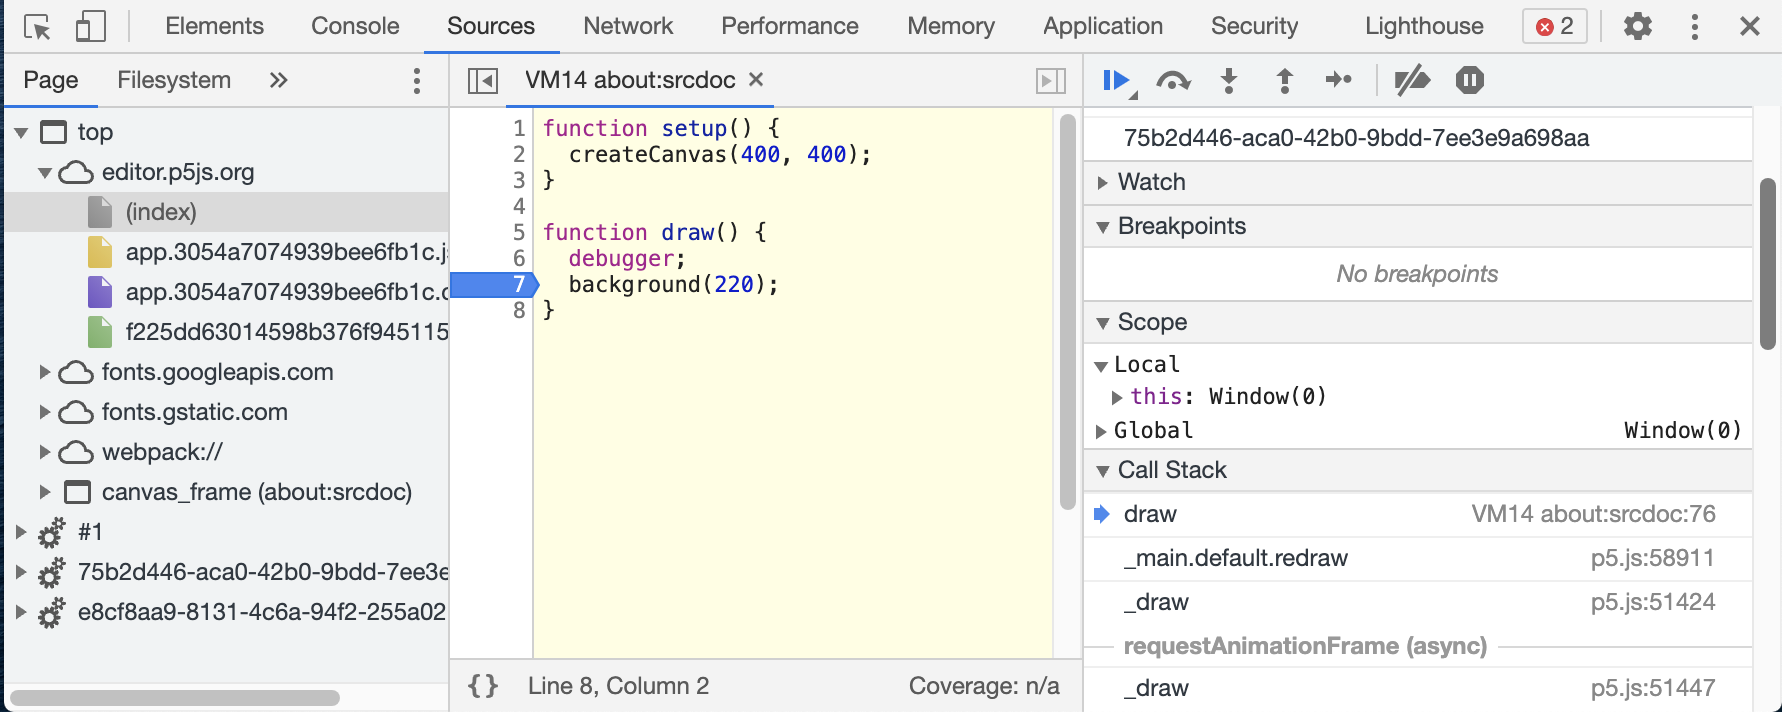
- It is difficult if not impossible to find the running sketch javascript via the Sources tab of the dev tools.
- The source opened when a
debugger;statement is executed doesn't show the execution pointer on the correct line. - Stack traces and the call stack in the debugger show incorrect line numbers.
Here's what the broken dev tools look like using the p5.js editor:
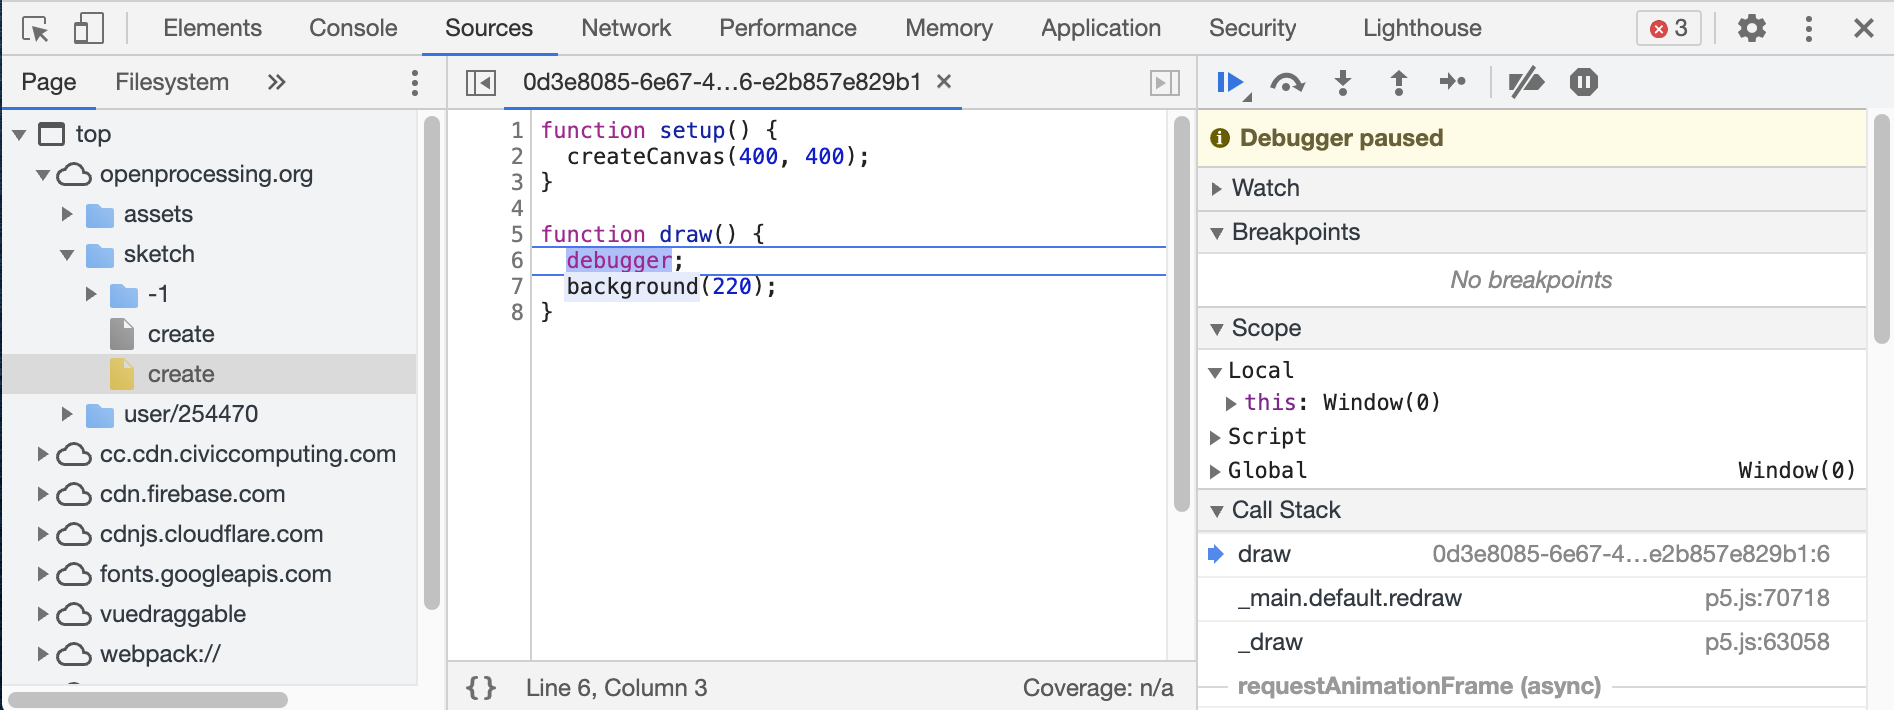
And here's what they should look like (using the OpenProcessing.org editor for comparison):
- Web browser and version: Google Chrome 90.0.4430.93 (also reproducible on other Chromium based browsers such as Brave)
- Operating System: MacOS
- Steps to reproduce this bug:
Metadata
Metadata
Assignees
Labels
No labels