Closed
Description
When using pcolor() to create a pseudocolor plot, default colors and grid isn't matching.
C = hadamard(20);
pcolor(C)


fig2plotly(gcf, 'offline', false);
Expected and generated (https://chart-studio.plotly.com/~xarico10/793/#/) plots:
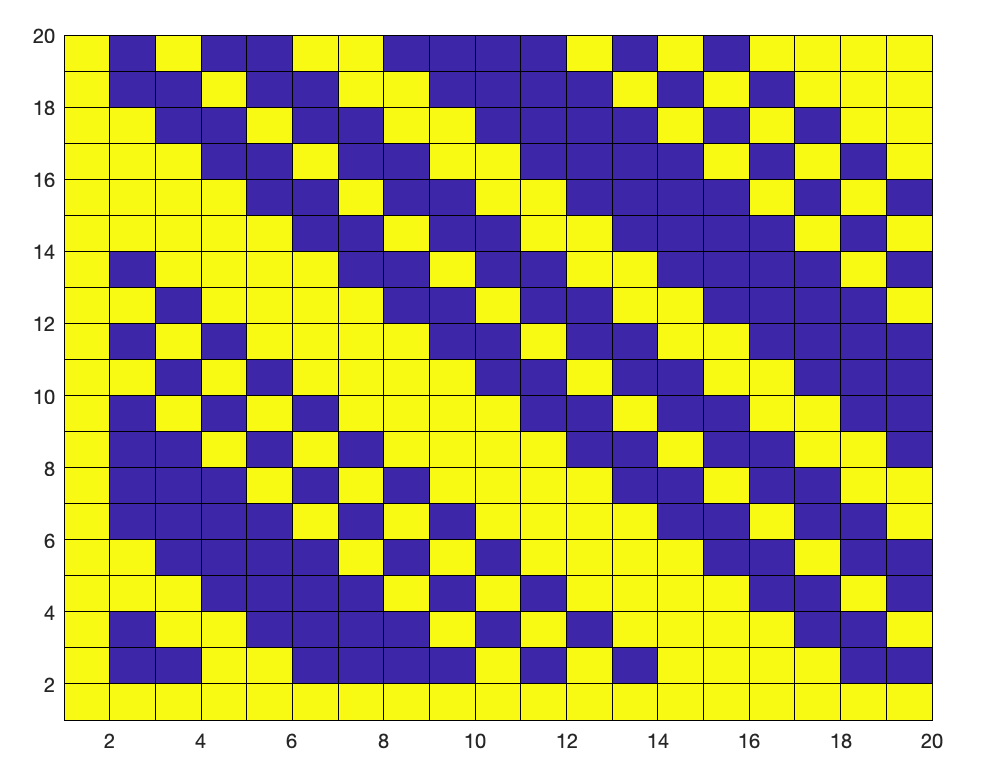

The colors aren't the same, the grid isn't printed and the plot starts at (1,1) coordinate, when it should start at (0,0).
Examples on using pcolor() can be found on:
https://www.mathworks.com/help/matlab/ref/pcolor.html#responsive_offcanvas