Closed
Description
Hello,
I have been trying to do some contour plot with some datasets. However, in some case the labels included 'undefined'.
Using the Chart Studio environment with a MWE (https://plot.ly/~Arkange/3/), I isolated the issue to the Max Contour value.
With one unique dataset, when Max Contour is set to 9772 or below, the right labels appear. When it is set to 9773 or above, 'undefined' appears and the values are not correct.
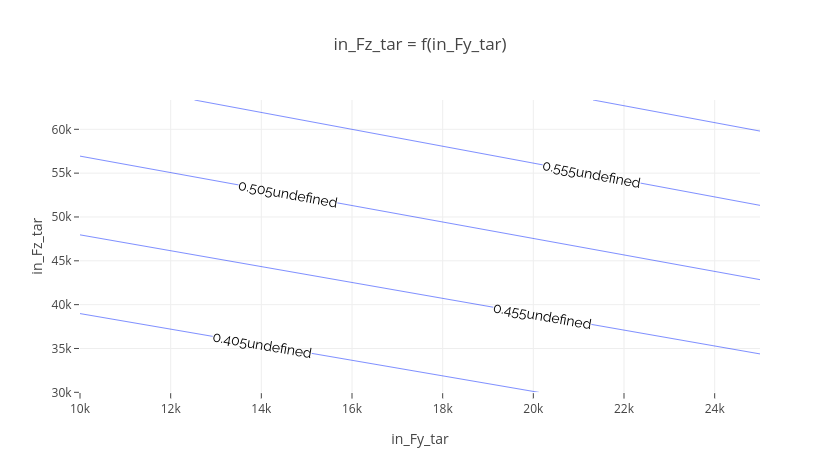
### With Max Contour = 9773:

### With Max Contour = 9772:

From the small tests I have made:
- I tried with values ranging from 3 to 6, or from 3000 to 7000, or from 3000 to 11000. As long as some z values are above 9773 and not restricted by Max Contour, the issue appears
- it does not depend on the Min Contour value or Step Size.
I have not systematically explored negative values or changed x- and y-axis datasets.