Description
This bug can occur when creating a bubble plot where a discrete variable determines color and a continuous variable determines size. If all of the points within a given color are the same size (or if there is only one point within that group) then the bubbles are sized incorrectly. When using sizemode = 'diameter' this issue does not occur, it only happens with the default sizemode = 'area'. Based on the experiments shown below it appears that these problematic points are having the size computed as diameter instead of area in either case, as they appear to have the same size in both modes.
I first asked about this on SO at (https://stackoverflow.com/questions/46571892/r-plotly-scatter-plot-marker-size-appears-to-depend-on-color-when-color-is-discr)
I did not include examples where color is based on a numeric or integer instead of factor or character, but I can attest this bug does not occur in those cases. (In cases where the legend is a gradient instead of discrete values.)
Possibly related to #755 about size of bubbles in the legend?
library(plotly)

# In these plots I will set x, y, and size to the same variable, so the
# largest bubbles should appear on the top-right and smallest on the
# bottom-left. The bug still occurs if you set x and y to other variables,
# but it becomes less obvious to see the phenomenon being described.

# Make a version of mtcars where 'carb' is a discrete variable. Here I
# make it a factor, but as.character() also works to demonstrate this bug.
my_mtcars <- mtcars
my_mtcars$carb <- as.factor(my_mtcars$carb)

# With the default sizemode = 'area', we have the bug, for the
# points corresponding to my_mtcars$carb %in% c(6, 8)
plot_ly(my_mtcars,
        x = ~wt,
        y = ~wt,
        size = ~wt,
        color = ~carb,
        type = 'scatter',
        mode = 'markers',
        marker = list(sizemode = 'area'))  # This is actually the default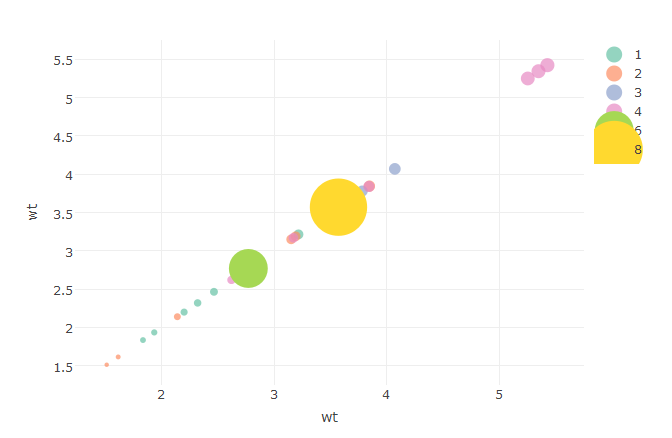
# Set sizemode = 'diameter' and the bug goes away
# (though I notice the problematic bubbles are the same size as
# they were in the plot with the sizemode = 'area'... hmm...)
plot_ly(my_mtcars,
        x = ~wt,
        y = ~wt,
        size = ~wt,
        color = ~carb,
        type = 'scatter',
        mode = 'markers',
        marker = list(sizemode = 'diameter'))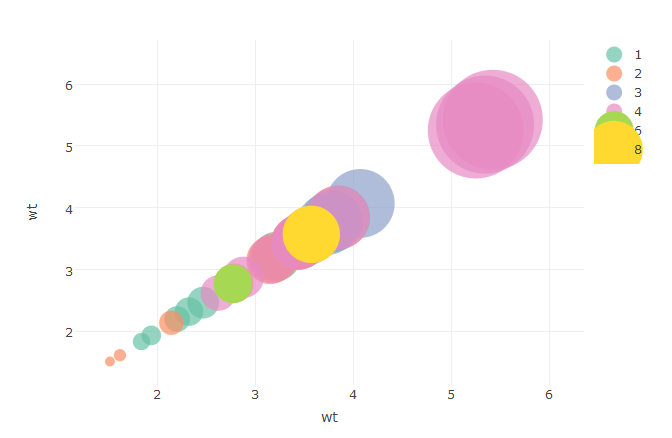
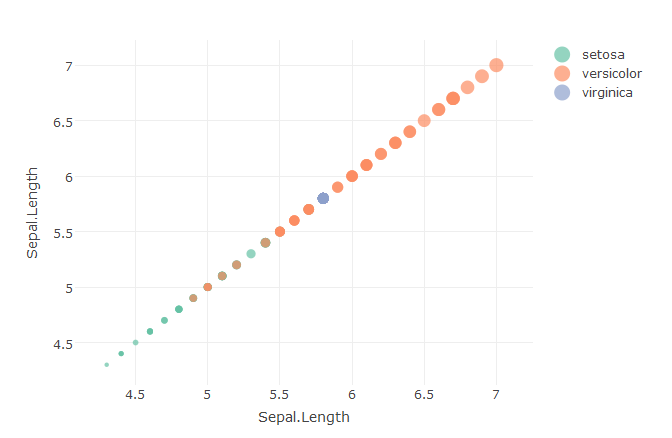
# If the points in each color group have distinct sizes, then the bug doesn't occur
my_iris <- iris

plot_ly(my_iris,
        x = ~Sepal.Length,
        y = ~Sepal.Length,
        size = ~Sepal.Length,
        color = ~Species,
        type = 'scatter',
        mode = 'markers',
        marker = list(sizemode = 'area'))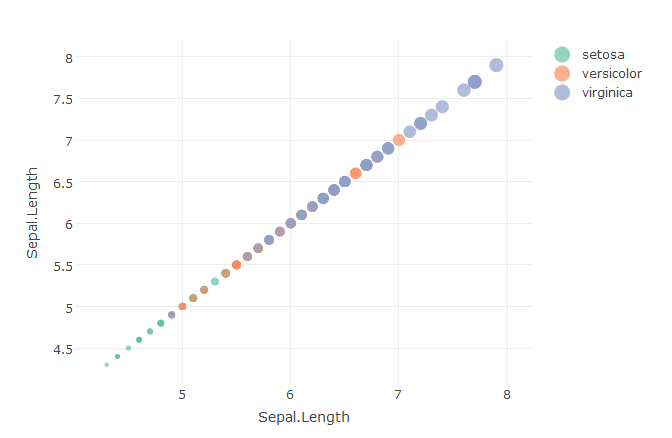
# But if all of the points in a group are the same size, then the bug appears
my_iris[my_iris$Species == 'virginica', ]$Sepal.Length <- median(my_iris$Sepal.Length)

plot_ly(my_iris,
        x = ~Sepal.Length,
        y = ~Sepal.Length,
        size = ~Sepal.Length,
        color = ~Species,
        type = 'scatter',
        mode = 'markers',
        marker = list(sizemode = 'area'))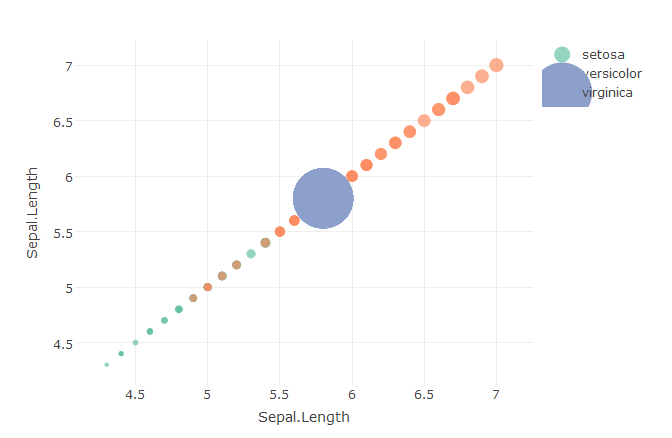
# Put a little jiggle on that Sepal.Length and the bug goes away again
my_iris$Sepal.Length <- my_iris$Sepal.Length + rnorm(nrow(my_iris), sd = .0001)

plot_ly(my_iris,
        x = ~Sepal.Length,
        y = ~Sepal.Length,
        size = ~Sepal.Length,
        color = ~Species,
        type = 'scatter',
        mode = 'markers',
        marker = list(sizemode = 'area'))