Description
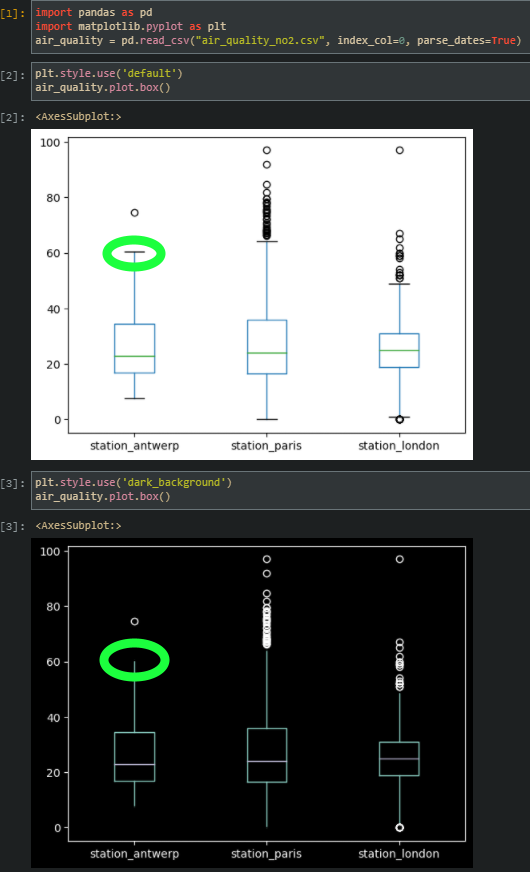
The min & max markers (the short lines at the ends of the whiskers) aren't visible with the 'dark_background' theme
Code Sample, a copy-pastable example
import pandas as pd
import matplotlib.pyplot as plt

# Data is from the pandas plotting demo
# https://pandas.pydata.org/docs/getting_started/intro_tutorials/04_plotting.html
air_quality = pd.read_csv("air_quality_no2.csv", index_col=0, parse_dates=True)

plt.style.use('default')
air_quality.plot.box()

plt.style.use('dark_background')
air_quality.plot.box()
Problem description
The min & max markers (the short lines at the ends of the whiskers) aren't visible with the 'dark_background' theme
I initially reported this as matplotlib bug here: matplotlib/matplotlib#19778
They concluded it was an issue with pandas.
diegopetrola said: "I also briefly investigated pandas and it seems they have a function called _get_standard_colors() in line 83 of the script called boxplot.py. I am fairly confident that it is this function that overrides the theme and causes the issue."
Output of pd.show_versions()
pandas : 1.2.3
numpy : 1.19.1
pytz : 2020.1
dateutil : 2.8.1
pip : 21.0.1
setuptools : 49.6.0
Cython : 0.29.21
pytest : None
hypothesis : None
sphinx : 3.1.2
blosc : None
feather : None
xlsxwriter : None
lxml.etree : None
html5lib : 1.0.1
pymysql : None
psycopg2 : None
jinja2 : 2.11.2
IPython : 7.13.0
pandas_datareader: None
bs4 : None
bottleneck : None
fsspec : None
fastparquet : None
gcsfs : None
matplotlib : 3.3.1
numexpr : None
odfpy : None
openpyxl : None
pandas_gbq : None
pyarrow : None
pyxlsb : None
s3fs : None
scipy : 1.5.2
sqlalchemy : None
tables : None
tabulate : None
xarray : None
xlrd : None
xlwt : None
numba : None